

DATA RESOURCES
Data has always been a driving force for B’more for Healthy Babies, helping our initiative evaluate needs in Baltimore City and the success of local interventions.
We make this data publicly available to help partners across Baltimore — and beyond — as they work to ensure every baby is born healthy and ready to thrive in healthy communities.
KEY INDICATORS FOR B’MORE FOR HEALTHY BABIES
Since its founding in 2009, BHB has relied on several key indicators, including Infant Mortality Rate (IMR), Teen Birth Rate (TBR), and Maternal Mortality Rate (MMR), to set and track an overarching strategy across Baltimore City.
The following charts provide trend data over the most recent two decades, city-wide and disaggregated by race.

Since BHB's inception in 2009 and through 2022 (most recent data available), the Baltimore City infant mortality rate (IMR) rate has decreased by 39% and the Black-white disparity in infant mortality has decreased by 48%.

From 2010 to 2022, the Baltimore City teen birth rate (TBR) has decreased by almost 60%.
The non-Hispanic Black-white racial disparity decreased by 70% during this time period. In 2022,
the non-Hispanic Black rate dropped below the citywide rate for the first time. The Hispanic/Latinx
teen birth rate remains the highest and is 8.5 times higher than the non-Hispanic white rate.

From 2010 to 2020, the Baltimore City maternal mortality rate (MMR) experienced a slight increase,
but overall remained fairly stable. However, when data is examined by race, the non-Hispanic Black rate increased by 30%, while the non-Hispanic white rate decreased by 35%. As a result, the non-Hispanic Black maternal mortality rate is 2.5 times higher than the non-Hispanic White rate in this time period.
The Maryland Department of Health collects and publishes this data annually, with a two-year lag (e.g., 2022 statistics were available in 2024).
NEIGHBORHOOD MAPS
BHB’s neighborhood-level disaggregation of health indicators revealed sharp racial disparities that had been masked by city-wide data. Click on each map to download a PDF version.


BCHD updates maps annually as data becomes available from the Maryland Department of Health, Vital Statistics Administration.
NEIGHBORHOOD PROFILES
Data-driven identification of high-risk communities led to targeted interventions; in Upton/Druid Heights and Patterson Park North and East, for example, this approach helped eliminate the Black-wite disparity in infant mortality. View neighborhood profiles: Upton/Druid Heights, Patterson Park North and East, and Cherry Hill.
The Baltimore City Health Department (BCHD) tracks data related to safe sleep across the city, by age and in comparison with statewide trends — all updated annually. A summary of findings and recommendations from the most recent case review processes is coming soon.
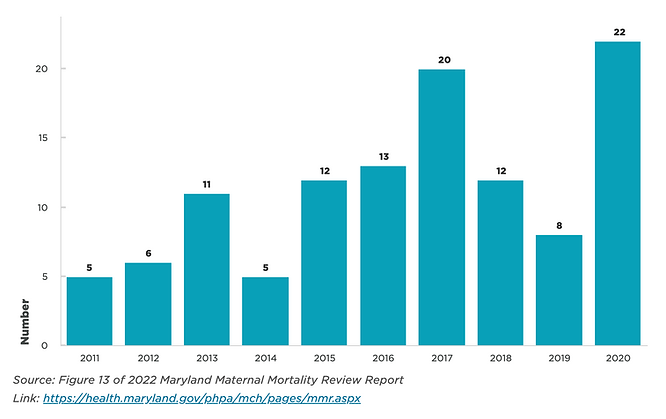
Overdose is the leading cause of maternal mortality in Maryland. In Baltimore City, between 2018 and 2023, the rate of fatal overdoses among women of childbearing age (15-44) increased 78%, and 320 female residents in that age group died of fentanyl-related overdose. More data is available on the Baltimore City Overdose Needs Assessment Dashboard and through BCHD reports.
Number of Pregnancy-Associated Deaths from Unintentional Overdose by Year, Maryland, 2011-2020
Jurisdictions across the country use confidential case review processes to better understand the factors leading to a loss of life and how to prevent it in the future. In Baltimore City, the Fetal Infant Mortality Review (FIMR), the Maternal Mortality Review (MMR), and the Child Fatality Review (CFR), are central to this work, with resulting recommendations documented to inform practice and policy change aimed at preventing mortality.
Findings and recommendations from the most recent case review processes are coming soon.
Other important recommendations are available through:
-
Maryland Maternal Health Innovation Program (MDMOM) Severe Maternal Morbidity Report
B’more for Healthy Babies’ uses data-informed decision-making to guide strategies, evaluate progress, and improve health outcomes for pregnant women, babies, and families. The approach helps understand and address persistent racial and geographic disparities in health outcomes.
Through local data, BHB can develop and implement strategies uniquely tailored to each community's needs, increasing the relevance, effectiveness, and impact of our work. This approach supports BHB's mission to promote social and economic justice, ensure quality care during pregnancy, and connect people to resources. This data also empowers community leaders and partners with the evidence they need to advocate for change, evaluate progress, and align resources.
Today, BHB works to:
-
Provide access to population-level data that is not publicly available;
-
Help find and access publicly available data;
-
Interpret and critically assess data trends and maps; and
-
Strengthen data literacy and communication, using an anti-racist lens.
ABOUT US >
Sponsored by the
Office of Mayor Brandon M. Scott,
Baltimore City Health Department, Family League of Baltimore, and HealthCare Access Maryland
Made possible by generous funding from CareFirst BlueCross BlueShield, City of Baltimore, Maryland Department of Health, and U.S. Department of Health and Human Services
To change your language preferences, update your browser's language settings and refresh the page to view content in your preferred language.